
Last updated: September 24, 2026 | By Richard Hale
Muscle mass percentage on a smart scale is skeletal muscle expressed as a share of your body weight. Typical figures land around 38 percent for men and 31 percent for women, drifting down gradually from your 30s and more noticeably from the late 40s. Consumer scales do not calculate it the same way, so treat your number as a personal trend to watch, not a grade to compare against other people.
This guide explains what the number means, roughly what is typical by age and sex, why it falls after 40, and how to track and improve it in a way that actually matters.
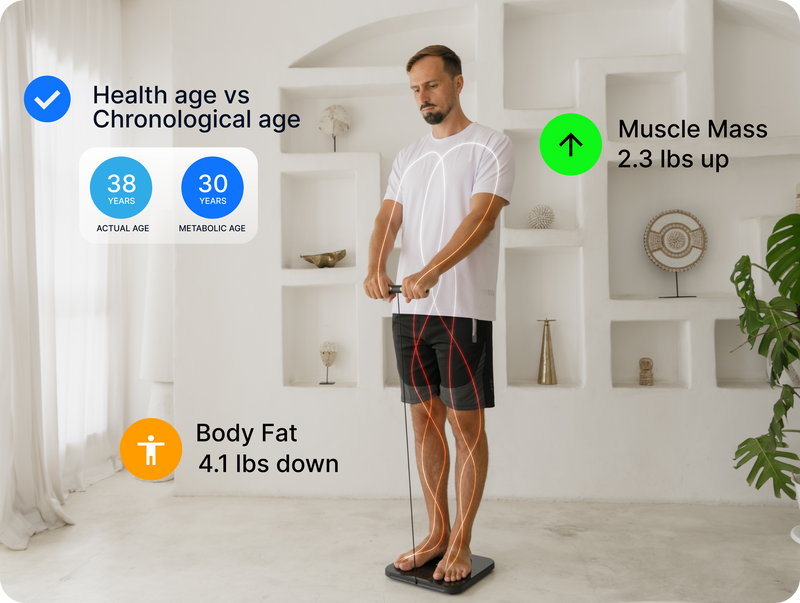
What “Muscle Mass Percentage” Actually Measures
The number refers to skeletal muscle, the muscle you consciously move with, as opposed to the smooth muscle in your organs or the cardiac muscle in your heart. A body composition scale estimates it from bioelectrical impedance, then divides that estimate by your body weight to produce a percentage.
Two practical consequences follow. First, brands define and calculate “muscle mass” differently, and some report total lean mass (which includes water and organs) rather than skeletal muscle specifically, so a reading on one scale is not comparable to a reading on another. Second, because it is a percentage of body weight, the number moves when your fat changes even if your actual muscle does not. Lose fat and your muscle mass percentage rises without a single gram of new muscle.
Typical Muscle Mass Percentage by Age and Sex
The clearest reference data comes from a 2000 MRI study in the Journal of Applied Physiology (Janssen and colleagues, 468 adults aged 18 to 88). It found skeletal muscle averaged 38.4 percent of body mass in men and 30.6 percent in women, with relative muscle mass beginning to decline in the third decade and absolute muscle mass dropping off noticeably from the end of the fifth decade, that is, the late 40s.
| Age | Approx. range, men | Approx. range, women |
|---|---|---|
| 20–39 | About 40–44% | About 31–33% |
| 40–59 | About 36–40% | About 29–31% |
| 60–79 | About 33–37% | About 27–30% |
Approximate ranges only. Consumer scales vary in how they define and calculate muscle mass, so use your own device’s reading as a trend rather than comparing it to a chart or to someone else’s scale.
Why the Number Falls After 40
Several changes compound after 40. The body loses fast-twitch (type II) muscle fibres preferentially, the number of motor units that activate muscle declines, and muscle becomes less responsive to dietary protein, a phenomenon called anabolic resistance. Add the reduced activity that often comes with busy years, and muscle mass slides at roughly 3 to 8 percent per decade if nothing counteracts it.
Strength declines faster than size. You can lose a disproportionate amount of power and function relative to the drop in muscle mass, which is why the scale percentage is only part of the picture. For the fuller story, see our guide to sarcopenia after 40.
Percentage vs Kilograms vs Skeletal Muscle Index
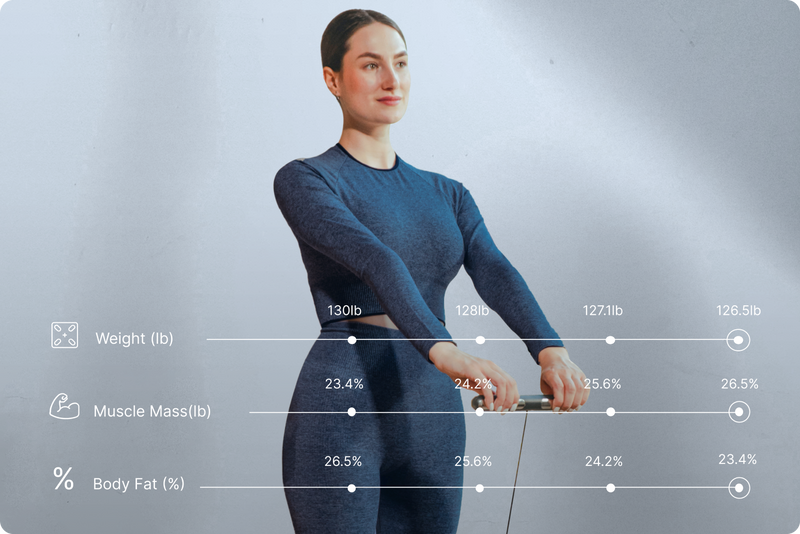
Three different numbers describe muscle, and they answer different questions:
- Muscle mass percentage is muscle as a share of body weight. It rises when you lose fat and falls when you gain fat, regardless of what your actual muscle is doing, which makes it a noisy way to track muscle change.
- Muscle mass in kilograms is the cleaner metric for tracking whether you are building or holding muscle, because it does not move just because your fat changed.
- Skeletal muscle index (appendicular muscle divided by height squared) is what clinicians use to screen for sarcopenia, with low cutoffs around 7.0 kg/m² for men and 5.5 kg/m² for women measured by DXA. This is a clinical measurement, not something a home scale gives you reliably.
For home tracking, watch your muscle mass in kilograms as the primary number and the percentage as a secondary check.
How to Track It Usefully
- Use the same scale under the same conditions each time: morning, after the bathroom, before food and exercise.
- Follow the kilogram figure and the percentage together. Muscle kg trending up over months means the training is working; percentage alone can mislead if your fat is also changing.
- Add a function check. Grip strength, how easily you rise from a chair without your hands, and your natural walking pace predict health outcomes better than any scale number. Our guide to grip strength and aging covers simple ways to test at home.
- Give it 8 to 12 weeks. Real muscle change is slow and only shows above the measurement noise over that kind of window.
How to Raise It After 40
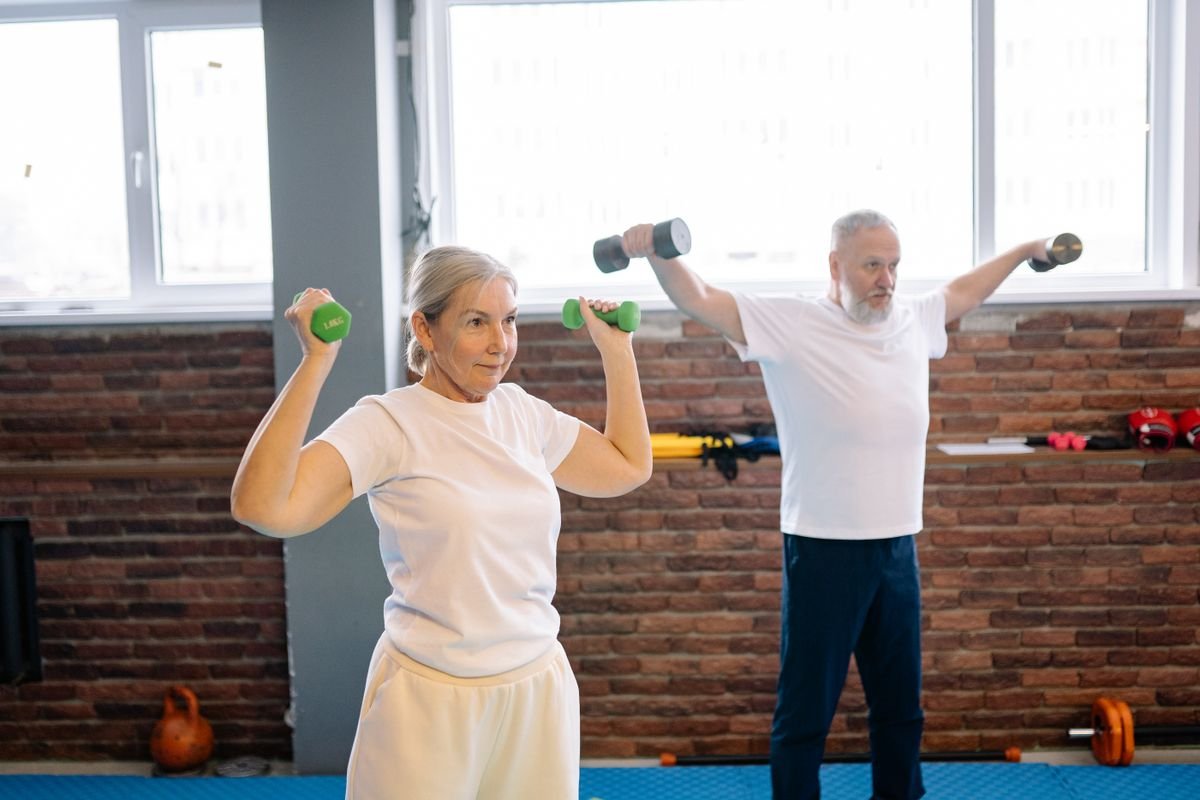
- Resistance training two to three times a week, covering all major muscle groups on non-consecutive days, with the load, reps, or difficulty increasing gradually over time. This is the non-negotiable part.
- Protein of roughly 1.2 to 1.6 grams per kilogram of body weight per day, spread across meals rather than saved for dinner. See our guide to protein after 40.
- Enough total calories. Building muscle in a large calorie deficit is difficult; a small deficit or maintenance works better.
- Consistent sleep, since most muscle repair and the hormones that support it happen overnight.
Muscle mass is one number in a bigger picture. See our guide to body composition after 40 for how it fits with body fat and visceral fat, and our Hume Body Pod review for one home device that reports a skeletal muscle mass trend.
Frequently Asked Questions
What is a good muscle mass percentage for a woman over 50?
Roughly 29 to 31 percent is typical for women aged 40 to 59, easing toward 27 to 30 percent past 60, though consumer scales vary in how they calculate it. More useful than hitting a chart figure is whether your muscle mass in kilograms is holding steady or rising and whether your grip strength and walking pace are stable.
What is a good muscle mass percentage for a man over 50?
Around 36 to 40 percent is typical for men aged 40 to 59, drifting to about 33 to 37 percent past 60. As with women, the trend in your kilogram figure and your functional strength matter more than matching a specific percentage.
Is 40 percent muscle mass good?
For a man, 40 percent is a healthy figure and typical of someone in their 30s or a well-trained older adult. For a woman, 40 percent would be unusually high and more likely reflects a scale that includes total lean mass rather than skeletal muscle specifically. Check what your device is actually reporting.
Why is my muscle mass percentage going down when I am exercising?
Usually because your body fat went up, which lowers muscle as a share of total weight even if your actual muscle is unchanged or growing. It can also reflect a shift in the scale’s body water estimate. Track your muscle mass in kilograms instead; if that is stable or rising, your training is working regardless of what the percentage does.
How much muscle mass do you lose per decade after 40?
Without resistance training, roughly 3 to 8 percent per decade through your 40s, 50s, and 60s, accelerating after 70. Strength tends to decline faster than muscle size. Regular resistance training and adequate protein can slow this substantially and, in many cases, rebuild some of what has been lost.
About the Author
Richard Hale writes about mobility, recovery, and evidence-based wellness strategies for adults over 40 at VitalMove40. He is an independent health writer, not a licensed medical professional. Content is educational and not a substitute for advice from a qualified healthcare provider.